How to enable trace and generate TKPROF in concurrent program in R12.2
Go to System AdministratoràConcurrent àProgram àDefine
Search the concurrent program name
Click the Enable trace check box and save the concurrent
program
Enable Debug from concurrent profile level
Navigate to profile -> System
Query "Concurrent: Allow Debugging" profile
Set profile to "Yes" This should be set in site level.
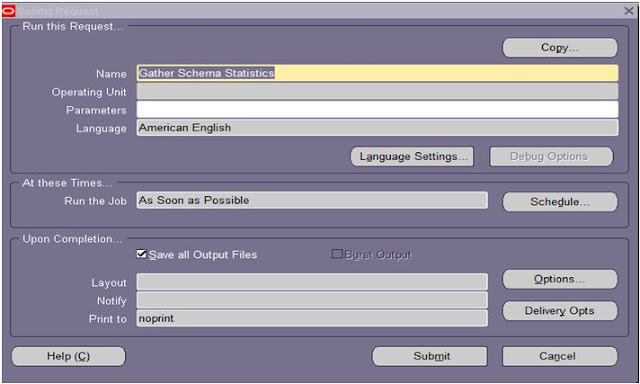
Submit the program
Run the below sql query under APPS User
Select concurrent_program_name from fnd_concurrent_programs where enable_trace='N';
Below query will provide the process id
Select oracle_process_id from fnd_concurrent_requests where request_id=<Request_ID>;
Below query will provide the trace file location
select value from v$diag_info where name='Diag Trace';
select value from v$parameter where name='user_dump_dest';
Collect the trace file from user_dump_dest location and generate tkprof using below command
tkprof <filename>.trc <filename>.txt sys=no sort='(prsela,exeela,fchela)'
Find the trace enabled concurrent programs
col User_Program_Name for a40
col Last_Updated_By for a30
col DESCRIPTION for a30
SELECT A.CONCURRENT_PROGRAM_NAME "Program_Name",
SUBSTR(A.USER_CONCURRENT_PROGRAM_NAME,1,40) "User_Program_Name",
SUBSTR(B.USER_NAME,1,15) "Last_Updated_By",
SUBSTR(B.DESCRIPTION,1,25) DESCRIPTION
FROM APPS.FND_CONCURRENT_PROGRAMS_VL A, APPLSYS.FND_USER B
WHERE A.ENABLE_TRACE='Y'
AND A.LAST_UPDATED_BY=B.USER_ID;
Concurrent manager Overview Click hear


Comments
Post a Comment